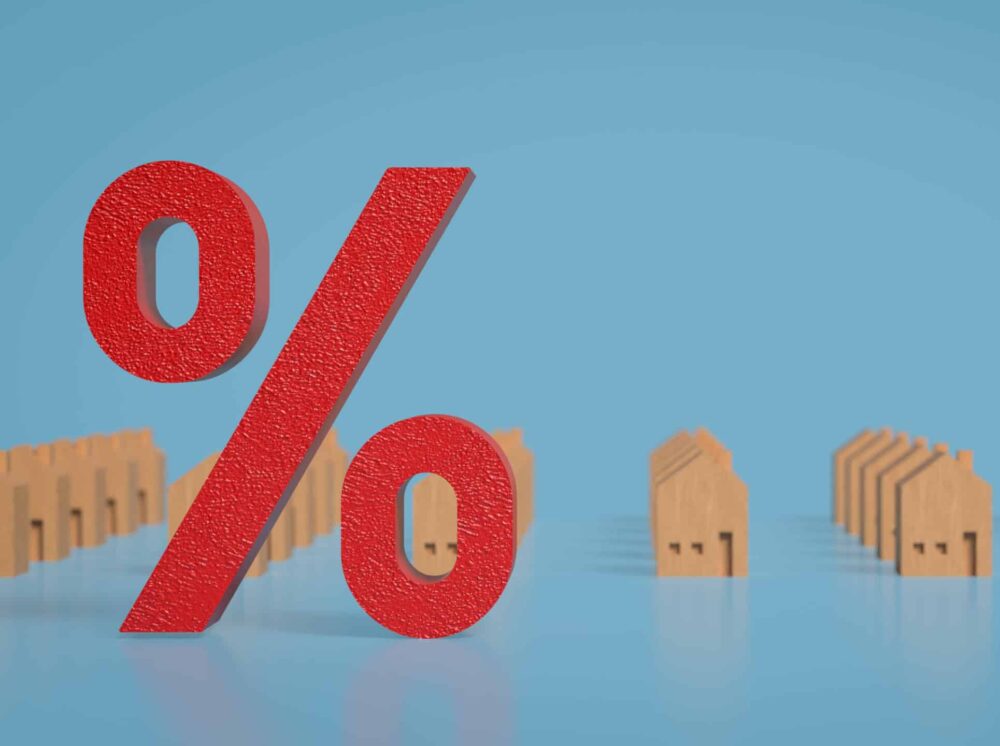
- In 10 years, there has been a 92% increase in the amount of property listed under overseas company ownership across England and Wales. From 47,787 properties in 2015 to 91,791 in 2025, this equates to almost double.
- The 91,791 properties currently owned by overseas companies is worth over £125 bn.
- Value of property assets held by overseas companies is at an all-time high, jumping 40% in three years equivalent to £38.5 bn.
- However, data suggests a decline in the number properties owned by overseas company ownership overall, with 3,834 fewer titles in 2025 than 2022.
- Jersey has overtaken the British Virgin Islands as the top country to hold UK wealth through overseas companies, holding £57 bn worth of UK property assets.
Latest analysis shows that across 10 years, the current registered volume of property in England and Wales owned by overseas companies has almost doubled to 91,791. Analysis by legaltech provider Search Acumen also highlights that the value of property under oversea ownership has jumped from £15.9 billion in 2015, to £125 billion today [Table 1]
According to Search Acumen, 2017 saw one of the largest annual increases in titles registered by overseas companies at 6,955 properties, whilst 2018 saw the highest value of new properties registered totalling £16.2 billion [Table 2].
Jersey is the top country on the register with the highest volume and value of properties currently registered under overseas company ownership, holding £57 billion worth of assets [Table 1]. This equates to a significant 25% of all properties registered under overseas company ownership, followed by the British Virgin Islands at 21%, Guernsey at 13%, and the Isle of Man at 11%.
Search Acumen looked at the rolling register of current properties under ownership by non-UK companies or corporate bodies that own land in England and Wales, as well as a real-time comparative analysis from 2022 against 2025.
In both cases, there is an overall decline in title volumes being registered. In the accumulative statistics, 2024 saw 3,171 properties registered: 210 less than the year before and 2,902 less than five years previous (2019) [Table 1]. In the non-accumulative comparison, the difference is more acute, with 3,834 fewer titles than three years previous [Table 4].
Whilst the rate of new properties being purchased by overseas companies added to the register is in decline, the overall value of these assets is firmly on the up. 2021 saw the highest increase in new properties by value with £16bn worth of new assets that year alone. Overall, values have risen 44% since 2022, equivalent to £38.5 billion [Table 4].
“The size of property wealth currently under ownership by overseas companies is eye watering, doubling in a decade. Whilst there are some gaps and inconsistencies in the data from its source through government records, it is widely indicative of wider investor trends and system that can and does protect the world’s most wealthy. “However, it is telling that the number of properties purchased by overseas-based companies are falling, currently at a ten-year low. This tells us two things; that either investors and the wealthy are buying assets and storing capital outside the UK, which is a troubling sign that our global appeal may be in decline, or that our property transaction system is becoming more stringent, noting increased transparency measures and anti-money laundering regulation in recent years deterring illicit purchases. “The likely answer is a bit of both. We know that the UK’s exit from the EU had huge economic consequences, including on the property industry. New taxes and rules for overseas investment has played a critical role in the decline since 2022, seen as a less attractive place post-Bexit, whilst in turn opening up opportunities for more domestic businesses. “We also saw in August 2022 the Register of Overseas Entities newly require overseas entities owning UK property to declare who their beneficial owners are, which included non-UK companies. This move indicated to the wider market a tighter grip on compliance by the government. Whilst reducing anonymity has to be a good thing, it may have in turn deterred some investors. This, combined with rising interest rates, higher borrowing costs, falling yields and slow capital growth, has likely made speculative investment less rewarding.”  Andrew Lloyd
, Managing Director at Search Acumen, says:
Andrew Lloyd
, Managing Director at Search Acumen, says:
| Year added to register | Total of properties – cumulative | Total sum of Price Paid for all properties – cumulative | Annual change in volume | Annual change in value |
| 2015 | 47,787 | £15,944,521,911 | ||
| 2016 | 54,063 | £23,288,861,939 | 13% | 46% |
| 2017 | 61,018 | £35,034,528,501 | 13% | 50% |
| 2018 | 66,875 | £51,310,042,986 | 10% | 46% |
| 2019 | 72,948 | £65,702,278,064 | 9% | 28% |
| 2020 | 76,390 | £77,065,994,446 | 5% | 17% |
| 2021 | 80,784 | £93,320,134,235 | 6% | 21% |
| 2022 | 84,652 | £106,271,133,782 | 5% | 14% |
| 2023 | 88,033 | £118,129,397,011 | 4% | 11% |
| 2024 | 91,204 | £123,952,524,539 | 4% | 5% |
| 2025 | 91,791 | £125,261,464,197 | 1% | 1% |
Table 1. Ten-year look at the yearly change in volume and value of registered properties under overseas company ownership, from 2015 to 2025. The data is based on cumulative live data from September 2025. See editors notes for more information.
Source: Search Acumen analysis of HM Land Registry data.
| Year added to register | Number of Properties added that year | Sum of Price Paid for all properties that year |
| 2015 | 5,169 | £7,317,493,924 |
| 2016 | 6,276 | £7,344,340,028 |
| 2017 | 6,955 | £11,745,666,562 |
| 2018 | 5,857 | £16,275,514,485 |
| 2019 | 6,073 | £14,392,235,078 |
| 2020 | 3,442 | £11,363,716,382 |
| 2021 | 4,394 | £16,254,139,789 |
| 2022 | 3,868 | £12,950,999,547 |
| 2023 | 3,381 | £11,858,263,229 |
| 2024 | 3,171 | £5,823,127,528 |
| 2025 | 587 | £1,308,939,658 |
Table 2. Ten-year look at the number of current registered properties under overseas company ownership, from 2015 to 2025. The data is based on cumulative live data from September 2025. See editors notes for more information.
Source: Search Acumen analysis of HM Land Registry data.
| Top 10 | Country | Number of properties | Sum of Price Paid for all properties | % of market |
| 1 | JERSEY | 23,290 | £57,020,353,214 | 25% |
| 2 | BRITISH VIRGIN ISLANDS | 19,475 | £20,554,446,189 | 21% |
| 3 | GUERNSEY | 12,308 | £9,473,195,947 | 13% |
| 4 | ISLE OF MAN | 10,090 | £7,368,176,692 | 11% |
| 5 | SINGAPORE | 2,114 | £1,281,393,054 | 2% |
| 6 | GIBRALTAR | 1,903 | £1,230,199,909 | 2% |
| 7 | LUXEMBOURG | 1,900 | £13,216,290,793 | 2% |
| 8 | HONG KONG | 1,672 | £986,014,241 | 2% |
| 9 | CAYMAN ISLANDS | 1,441 | £1,581,913,640 | 2% |
| 10 | IRELAND | 1,389 | £373,007,886 | 2% |
Table 3. The top 10 countries with the current highest volume of overseas companies registered as owners of UK property by count and by total value. The data is based on cumulative live data from September 2025. See editors notes for more information.
Source: Search Acumen analysis of HM Land Registry data.
| Total properties as of that year – static figures | Sum of all properties that year – static figures | |
| 2022 | 95,625 | £86,744,598,568 |
| 2025 | 91,791 | £125,261,464,197 |
Table 4. Historic comparison of two static datasets; one from cumulative 2022 results, and one from cumulative 2025 results as of September in both years. By comparing these static datasets, results show the dip in volume of properties in three years due to removal from the register when ownership has changed back to a UK-based listed owner through its sale. See editors notes for more information on the data.
Source: Search Acumen analysis of HM Land Registry data.